
If you find yourself needing to work with Geo data you might find yourself reaching for tools like ElasticSearch, or your favorite SQL database, to allow for geospatial searching. If you love DynamoDB as much as I do you cringe whenever you have to leave the comfort of the scale, performance, and availability of DynamoDB. In this article I’ll show you how you can use DynamoDB for Geo data, so you don’t have to resort to those other databases.
Geohash
To get started you first need to understand the idea of a geohash. The short version of it is that it takes the globe and divides it up into rectangles. The more digits or characters in the geohash the smaller, and more precise, the rectangle is. I’m not going to go in depth about they work, or even into how to calculate them, after all, that’s what libraries are for, I’m simply going to show you how you can use them to do querying in DynamoDB. Keep in mind that there are some edge cases where a geohash fails (you can read about them in the above linked Wikipedia article), but most often it will work fine for what you are doing.
Here is an example of what it looks like overlayed on map:
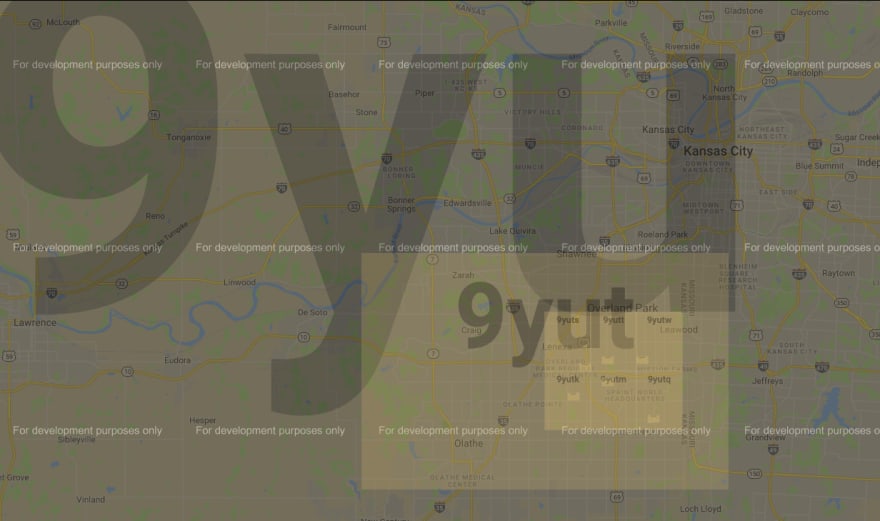
Notice that each box inside of a box starts with the same characters as the outer box, always adding one character as the precision increases.
Check out this website to see how it works on a map. Be sure to zoom in and see how the small the rectangles get.
The first step in using a geohash is calculating what the geohash is for a given coordinate. There are a lot of libraries out there for this; I’ll be using the node-geohash library for my example. There are implementations of this library in most languages. To get a geohash just call the encode function with the latitude and longitude of the point for which you want a geohash.
import geohash from 'ngeohash';

const hash = geohash.encode(38.9153287, -94.6393130);
console.log(hash);
This will output 9yutqkmf0
As you can see, getting the geohash is easy. I’ll let you figure out how to get the latitude and longitude for a location (hint: there are a lot of services that can help you there, including Amazon Location Service (Preview)).
Storing the Data
Next, we need to store it in a DynamoDB table. I’m a big fan of the single table design, so I’ll use a table with a very simple structure. I’ll have a partition key called pk, and a sort key called sk. I’m also going to include a GSI that will be used for querying the geohash; I’ll name the GSI gsi1, with keys of gsi1pk and gsi1sk. I love BBQ, and I live in the BBQ capital of the world, Kansas City (don’t argue with me on this, I’m right), so I’ll use BBQ restaurants as my location data. The data will look something like this:
{
  "pk": "joes-kc-leawood",
  "sk": "Loc",
  "gsi1pk": "Geohash",
  "gsi1sk": "9yutqkmf0",
  "id": "joes-kc-leawood",
  "name": "Joe's KC BBQ",
  "streetAddress": "11723 Roe Ave",
  "locality": "Leawood",
  "region": "KS",
  "postalCode": "66211",
  "country": "USA",
  "latitude": 38.9153287,
  "longitude": -94.6393130
}
Notice that I put the geohash value in gsi1sk. It’s important that it be put in a sort key so it can be queried using partial matching, like begins_with.
The Bboxes Function
Assuming my table has all my data in it, I want to find the ones to display on a map. Once again, I’ll use the node-geohash library, this time to find all the geohashes within view using the bboxes function.
import geohash from 'ngeohash';

const hashes = geohash. bboxes(38.9105, -94.7308, 38.9706, -94.6194, 5);
console.info(JSON.stringify(hashes));
This will output ["9yutk","9yutm","9yutq","9yuts","9yutt","9yutw"]
The bboxes function is pretty simple to understand. You provide it a bottom left and top right corner and it returns all the geohashes that are in (including partially in) that rectangle. You may have noticed one more argument that is passed in. This is the precision to use (i.e., how big the geohash boxes are). I used 5 for this example. You’ll notice that the output was a set of geohash values that have only 5 characters, which is the precision I asked for. Feel free to adjust this according to your needs (and even dynamically calculate it based on the size of your rectangle). Keep in mind, too many results from the bboxes function mean a lot of queries to find the matches. Too few results mean a lot of matches in each query, likely needing some filtering. Different use cases may have different needs. For example, if you have a small number of records over a large area you are probably fine using very low precision. In fact, if you increase the precision too far, you’ll have a lot of queries with no results. On the other side, if you have a lot of records in a smaller area, you’ll want to make sure you are querying with a higher precision.
Querying
Now that I’ve got a bunch of geohashes it’s time to query the data. To do that we need to run one query for each of the geohash boxes. Each query will use the geohash in its query, like this:
const documentClient = new AWS.DynamoDB.DocumentClient();
const result = await documentClient.query({
            TableName: 'working-with-geo-data-in-dynamodb',
            IndexName: 'gsi1',
            KeyConditionExpression: '#pk = :pk AND begins_with(#sk, :hash)',
            ExpressionAttributeNames: {
                '#pk': 'gsi1pk',
                '#sk': 'gsi1sk'
            },
            ExpressionAttributeValues: {
                ':pk': 'Geohash',
                ':hash': geohash
            },
        }).promise();
Notice that we are looking for records whose geohash (stored in the gsi1sk field) begins_with the value of the geohash we are looking for. Since I asked for a precision of 5 it will find all records whose geohash start with the five characters of the geohash I’m matching. Each query will return the records that are within the geohash box. You won’t need to worry about duplicate records; the boxes don’t overlap. You may need to remove records that are outside of your rectangle, depending on your use case. If you are just putting pins on a map, then it probably doesn’t hurt to include pins that are off screen. If you are showing a list, then filtering makes sense. That filtering is pretty simple, just check the latitude and longitude of the record and see if it falls within your rectangle.
That’s really it. With this example you can query geo data in DynamoDB.
Try It Out
If you want to give it a try, I have a working example on GitHub that you can deploy to your AWS account. https://github.com/jasonwadsworth/blog-code/tree/main/working-with-geo-data-in-dynamodb